
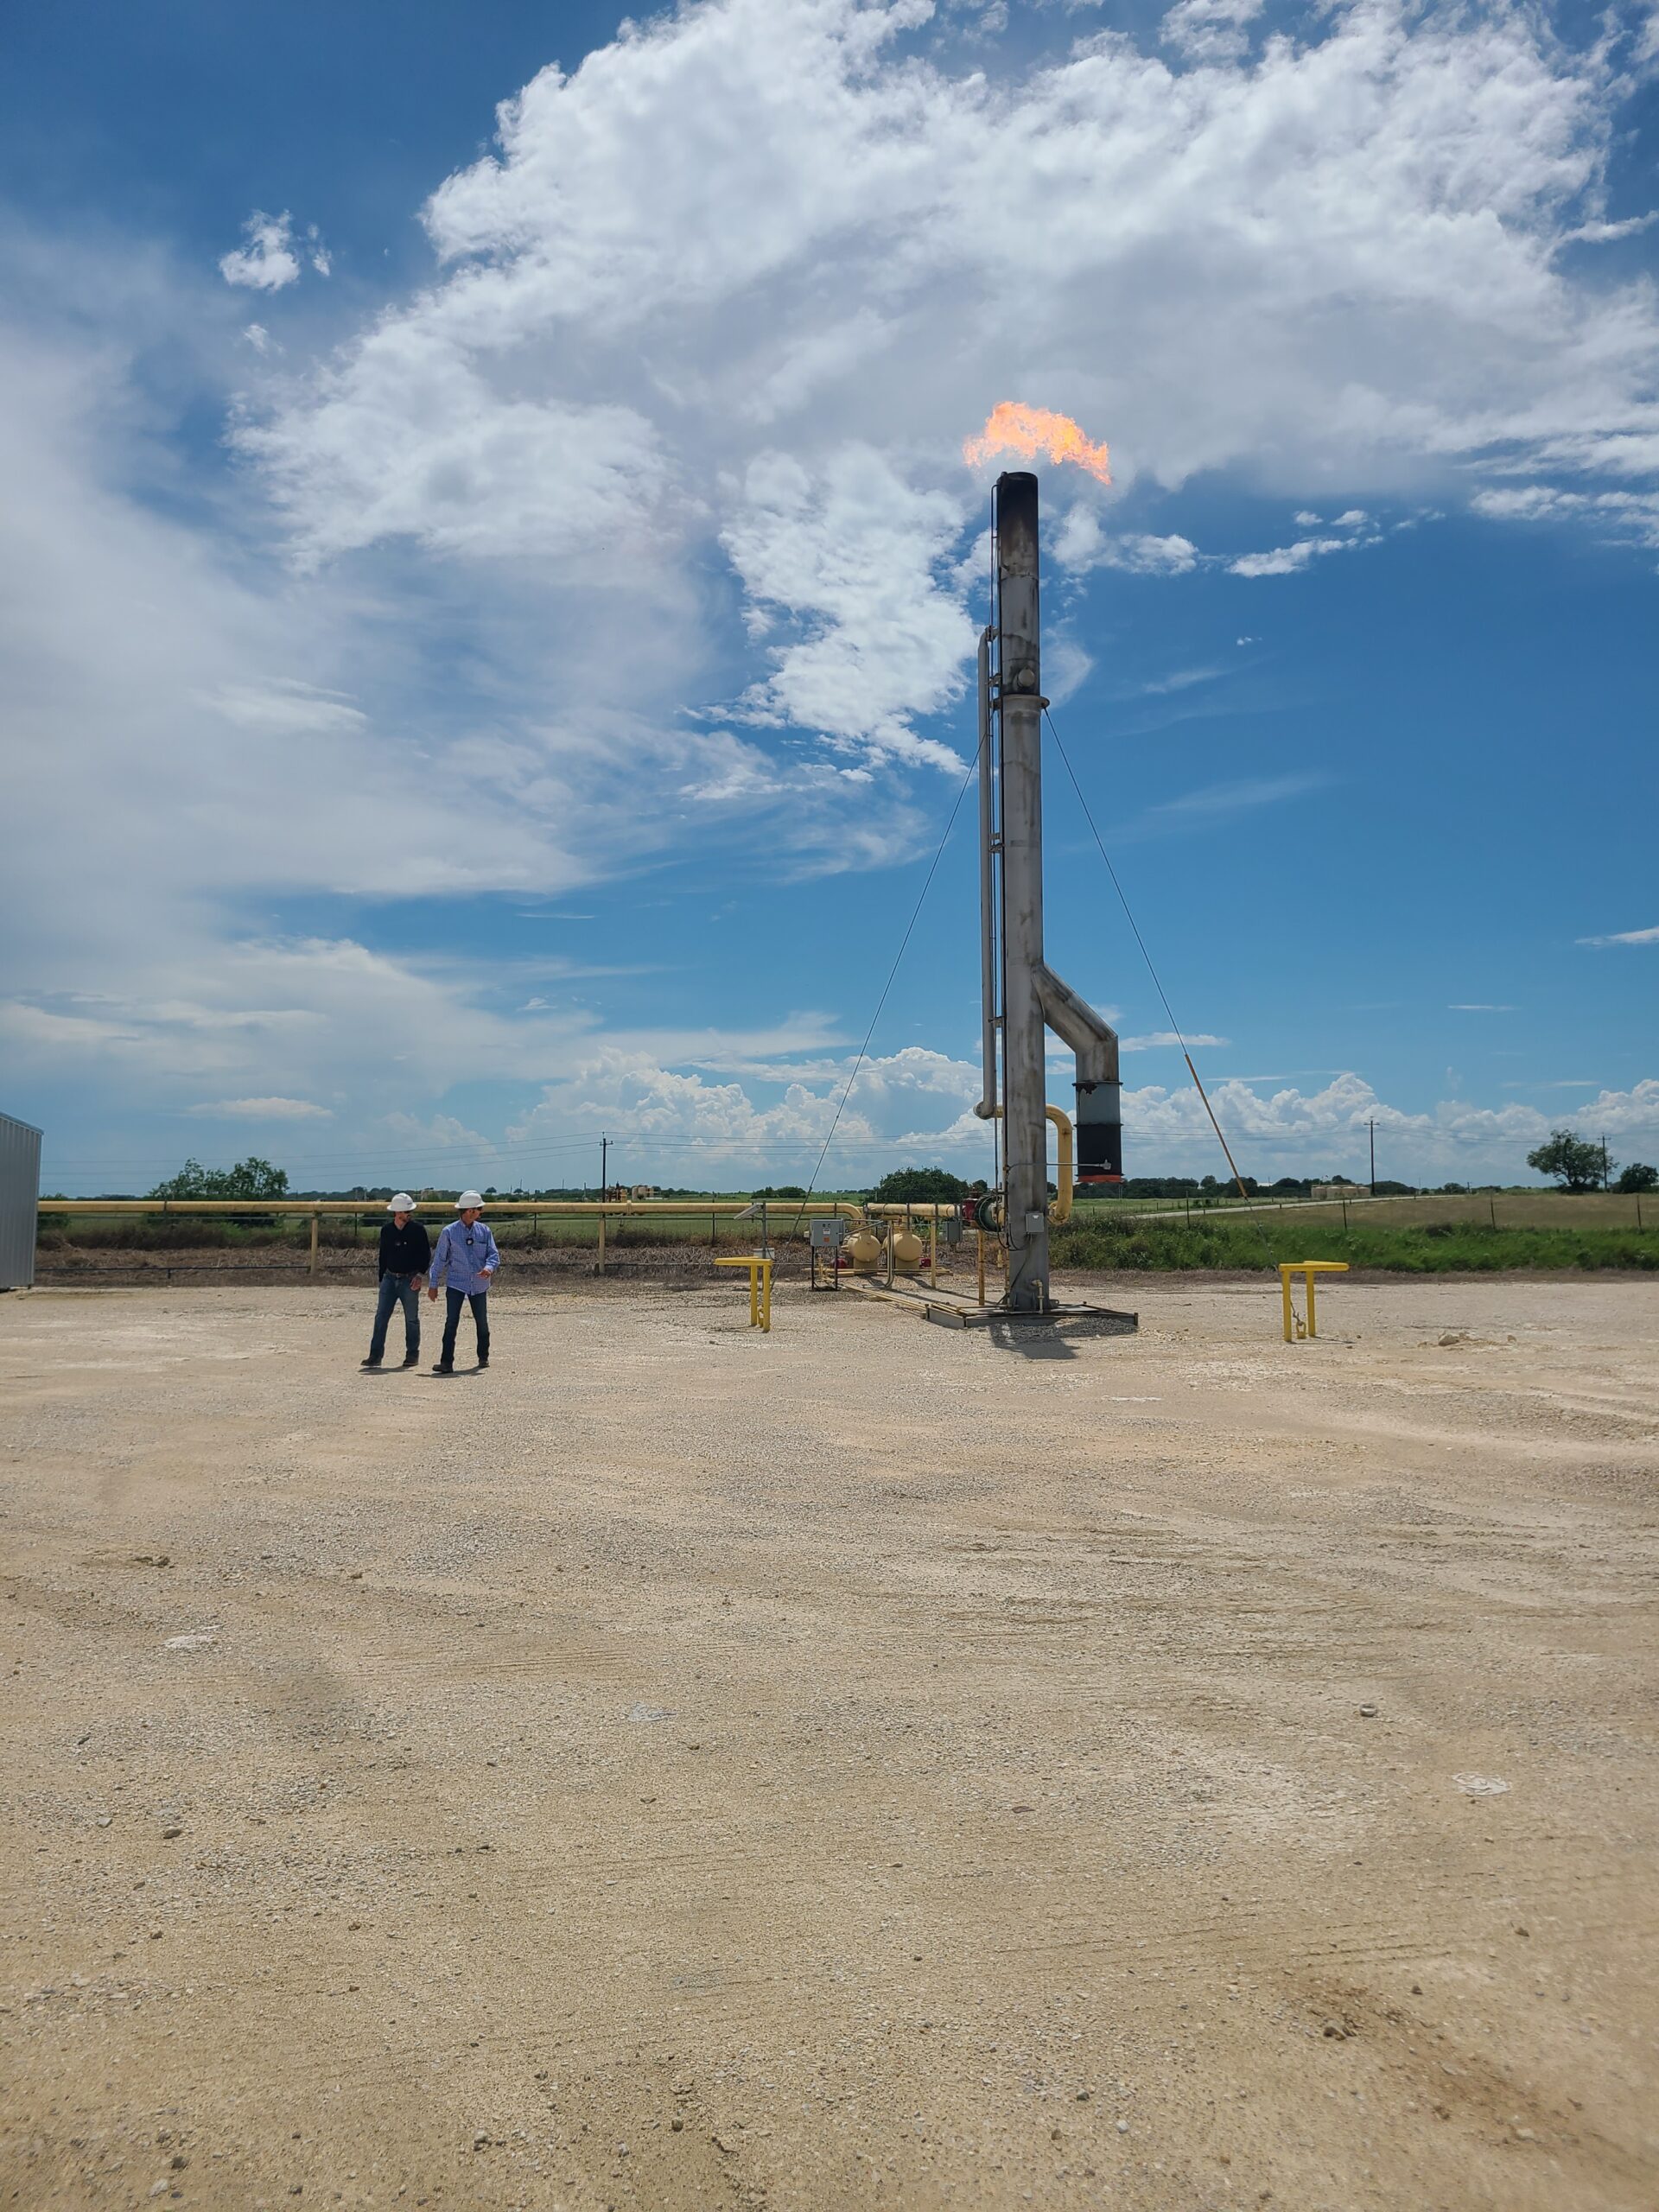
Promoting Flare Efficiency Practices
TEP companies have made significant progress in reducing overall flare volumes since TEP’s flare management program was launched in 2020.
Last year, The Partnership conducted a study to better understand and promote flare efficiency and reliability best practices for times when flaring is necessary. Flaring typically occurs when there is a lack of takeaway or processing capacity, during facility or downstream facility maintenance, or during unplanned events that may require flaring to safely alleviate pressure. In these instances, flaring is better for the environment than venting the gas directly into the air because it releases fewer greenhouse gases.
The study focused on flare destruction and removal efficiency (DRE) to better understand what DRE can be achieved and what factors might affect DRE. It involved four weeks of testing in three basins (Eagle Ford, Permian, and Bakken), coordinating with 11 operator partners and evaluating over 180 flares from 13 manufacturers. Enclosed combustion devices were not included in this study.
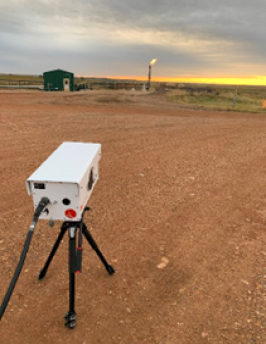
Commercially available VISR (Video Imaging Spectral Radiometry) and Simplified VISR technology were selected for DRE measurements to attempt to identify practices that lead to good performance. VISR and Simplified VISR both measure flare performance metrics at 1-second intervals including smoke index (visible emissions; an alternative to EPA Method 22 or Method 9), fractional heat release (flare gas flowrate), presence or absence of pilot flame, flame thermal footprint, and flame stability. They also directly measure flare combustion efficiency (CE) with established methodology to derive a DRE measurement utilizing established correlations between CE and DRE.
STUDY RESULTS
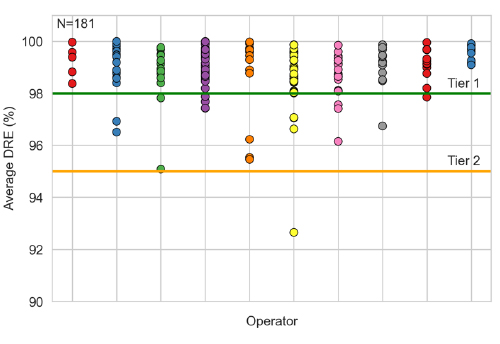
Results from the VISR DRE data showed that 89% of the normally operated flares tested were above 98% DRE, 99% were above 95% DRE, and100% met the 92% DRE threshold. (Figure 4). These results suggest that using EPA’s default tier categorization for calculating emissions from flares may overestimate emissions. In the Bakken basin, 89% of flares tested during normal operations were above the 98% DRE threshold with an additional 10% above the 95% DRE threshold. In the Eagle Ford and Permian basins combined, 88% of flares tested during normal operations met the 98% DRE threshold and all flares exceeded the 95% DRE threshold.
Flare installation date did not appear to play a significant role in DRE results.
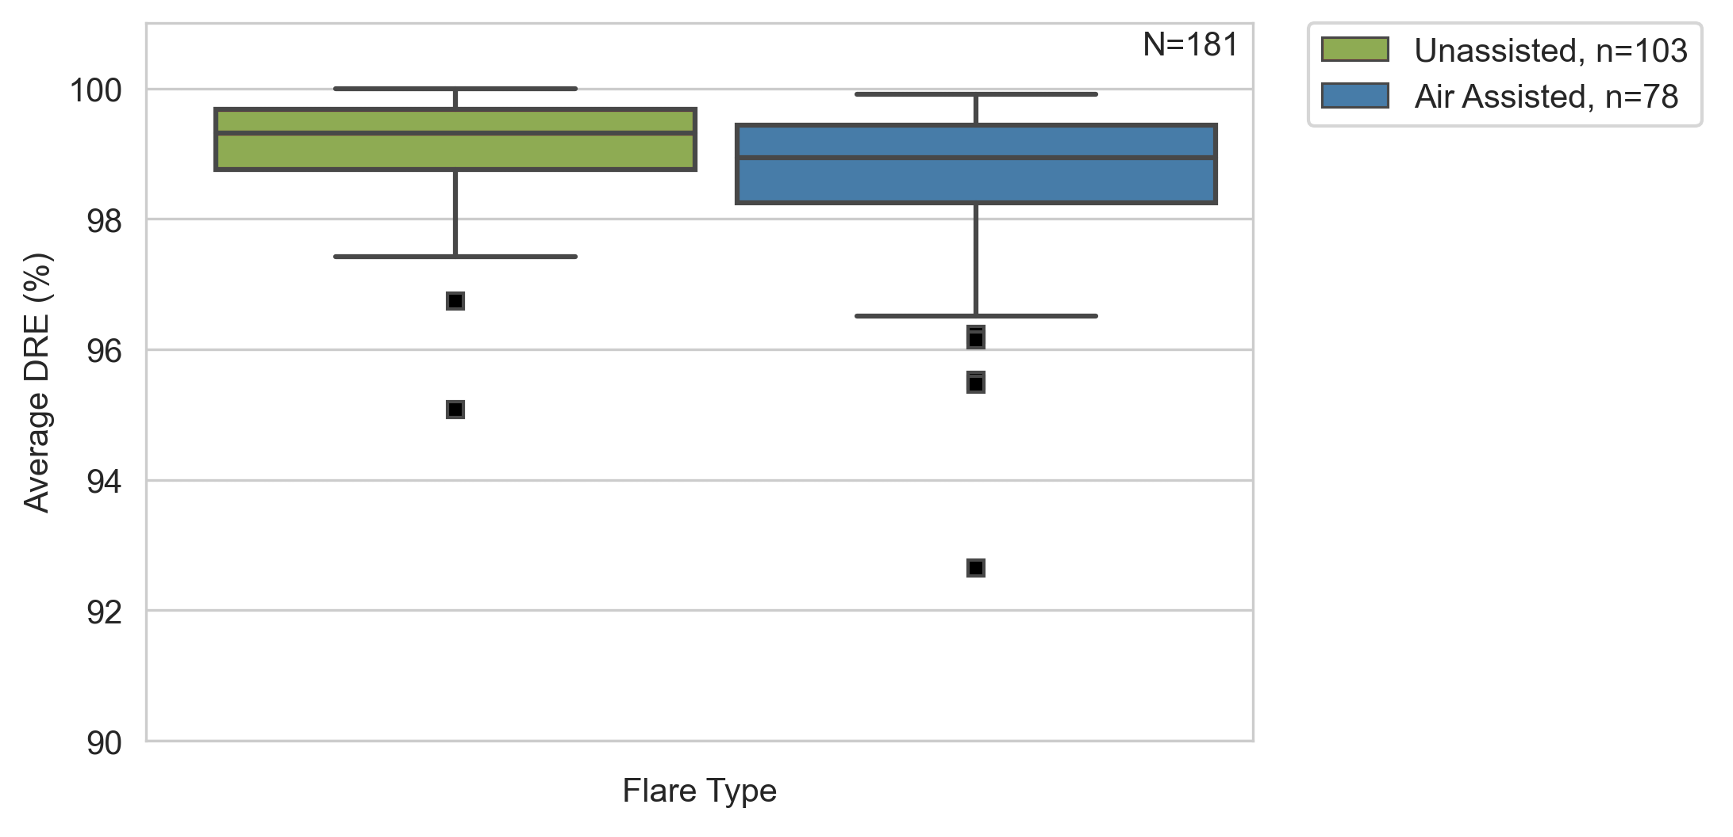
Results also showed minimal difference between flare types and average DRE.(Figure 5).
TEP participants are committed to better understanding the flare operation adjustments necessary to achieve optimal flare performance. Additionally, we will continue to work with manufacturers on flare designs that accomplish both lower opacity and high DRE results.
STUDY TAKEAWAYS
In addition to furthering participants’ understanding of flare DRE, the study also identified the following best practices solutions that study participants are implementing to ensure flaring efficiency:
- Using a continuous pilot and/or an auto-ignitor, and in some cases having multiple pilots,
- Actively managing liquids in the vapor collection system (VCS),
- Monitoring flares with a thermocouple and including options such as an on-site security camera,
- Conducting daily visual inspections, Including the flare, pilot, VCS, and FA/DFA in a maintenance program, and
- Having alarms set to notify staff when a flare or flare pilot is dow